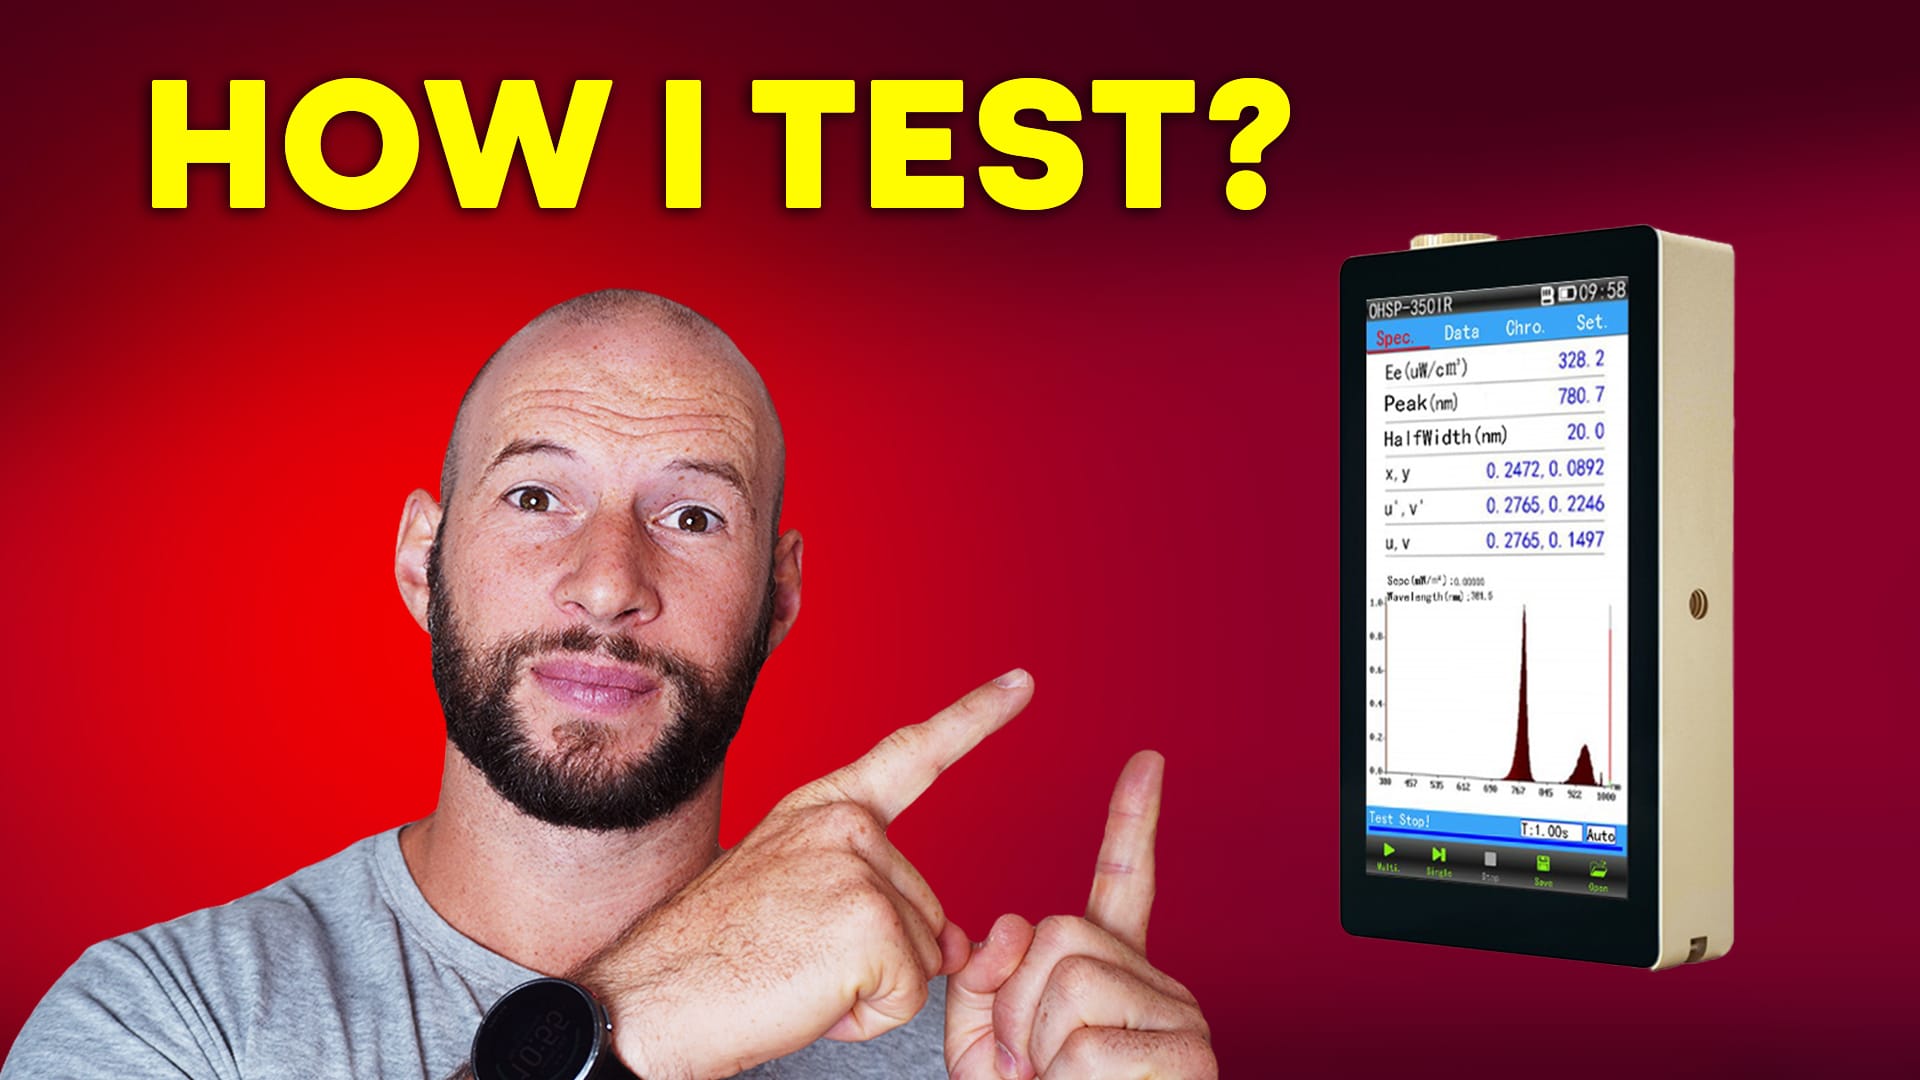
Have you ever wondered how I test my red light therapy devices? How do I get those visuals on screen, or where do those accurate irradiance figures come from?
Well, the answer is a device called a spectrometer. More specifically, the Hopoocolor OHSP-350-IRF spectrometer.
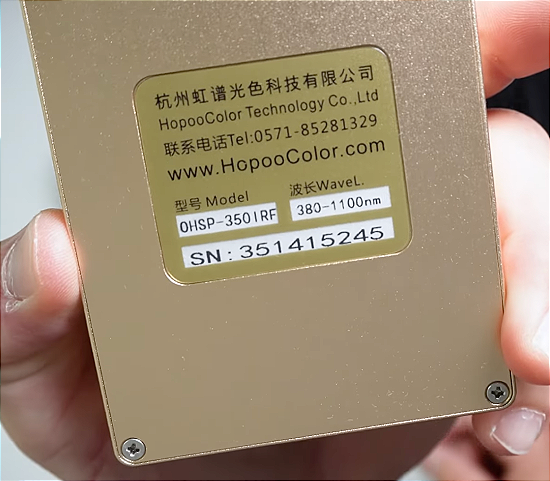
This isn’t your everyday gadget. Retailing for about $2,500, it’s not cheap. But it’s also the backbone of every accurate test and review I publish. Recently, I upgraded from my older model to this new version. At first glance, they appear identical, and for the most part, they function similarly. The difference is that the new model reads a little deeper into the near-infrared range—up to 1100 nanometers.
My old one only went to 1050. With many new devices now adding wavelengths like 1050, 1060, and even 1070nm, I needed a tool that could actually measure them.
This article is my review of this spectrometer itself—how it works, what’s included, how I set it up, and why I use it.
Unboxing and First Impressions
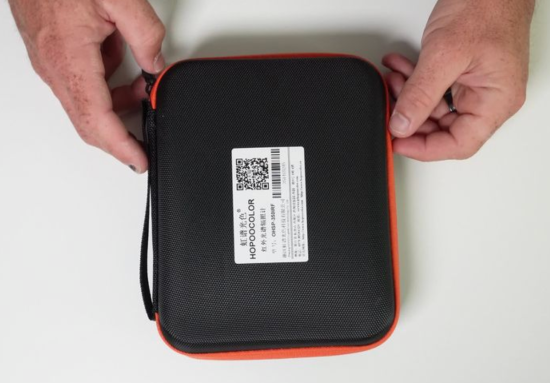
The spectrometer comes in a compact carry case, which I’ve found really useful when traveling to events and expos. Inside the case, you’ll find a quick-start manual, a spare sensor, a few cable accessories, and a soft cloth storage bag. Everything is neatly packed, making transportation and device protection easy.
The spectrometer itself is slightly larger than an iPhone, though quite a bit thicker. Despite that, it’s still small enough to slip into a pocket. I’ve even seen people carrying them that way at events. It’s portable, it has excellent battery life, and while I don’t know the exact rating, I rarely find myself needing to recharge it. When you do plug it into a computer, it charges automatically. The battery is built-in and non-replaceable, but I’ve never found that to be an issue.
Holding it in the hand, it feels solid. There are mounting points on the side, allowing you to screw it onto a tripod for added stability. The sensor sits at the top, and if you damage it, the spare included in the box is a lifesaver. A small but important upgrade from the older model is the USB-C port (the old one had micro-USB). It also includes an 8GB microSD card, which is more than enough to store test files.
Powering It On
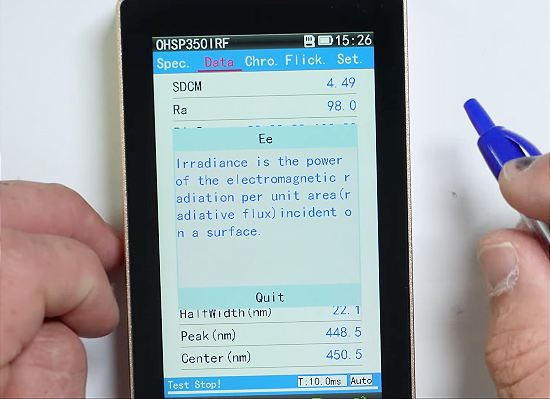
Once turned on, you’re greeted with a blank touchscreen interface. Taking a snapshot reading is simple—you just press the button on the side. Instantly, data appears on the screen. Out of the box, the device is calibrated, but you can recalibrate it later if needed.
I first had to tweak the settings, as mine defaulted to only 780nm. Changing that to 1100nm was easy. Now I could capture the full range I wanted—from 380nm all the way out to 1100nm.
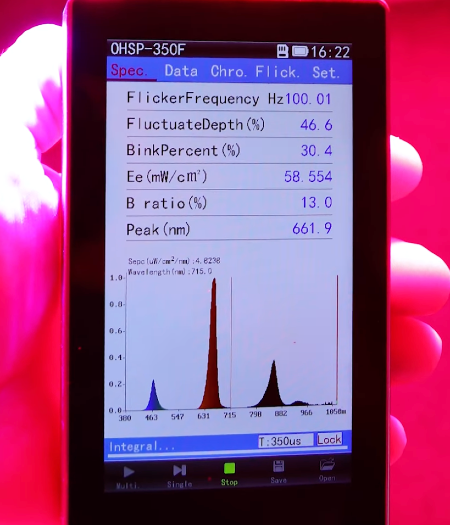
From there, the data breakdowns become interesting. You can view spectral power distribution charts, flicker testing results, lux readings, and, of course, the key irradiance numbers. These are the infamous milliwatts per square centimeter figures you often see in my reviews.
Diving Into the Features
The interface lets you customize exactly what you see on the overview screen. For example, I like displaying:
- Peak nanometer wavelength
- Red percentage ratio
- Irradiance (EE)
- And three flicker readings at the top
It’s all touchscreen-based, so it’s easy to adjust on the fly.
The device allows for single readings (a snapshot) or continuous multi-readings. The latter is particularly useful when moving the sensor around a red light panel, since you can see how the output changes in real-time. You can also adjust the test intervals if you’re working with flickering devices, though the automatic mode usually handles this well.
And of course, there’s a save function. Each reading can be named, saved, and later opened directly on the spectrometer or exported to a computer for further analysis.
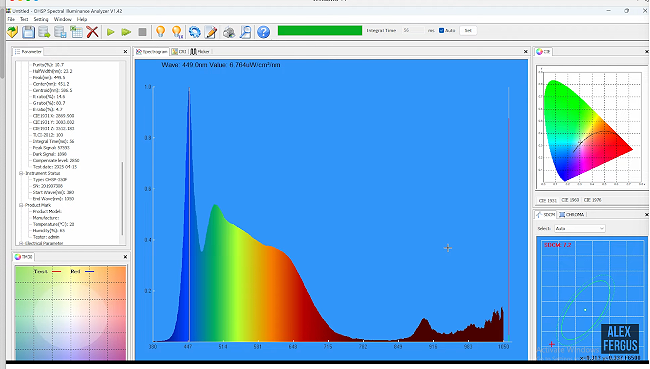
Exporting the Data
Exporting to Excel is where the magic really happens. The raw data file includes everything from the peak wavelength to irradiance figures for every single nanometer measured. You can break down power ranges (such as 620–680nm), compare readings across different times of day, and even analyze ratios between red, green, and blue.
If you’ve seen my comparison between red light therapy and natural sunlight, you’ve seen the type of analysis this enables. It’s nerdy, yes, but it allows for extremely detailed testing.
Connecting to a Computer
Plugging the spectrometer into a Windows machine unlocks even more functionality. You can view real-time data directly on your screen, save readings instantly, and get access to additional visualization tools. This setup is especially useful if you need precise measurements, as you can mount the spectrometer on a tripod and trigger readings directly from the computer.
Price and Where to Buy
As mentioned earlier, the OSP-350 IRF sells for around $2,500. I purchased mine directly from Hop00color. If you’re interested, you can email my contact Jamie, [email protected]. Mentioning my name should get you a discount—possibly a few hundred dollars off. I do receive a small commission, but you don’t have to use my name if you’d rather pay full price or negotiate your own deal.
How Does It Compare?
Over the years, I’ve seen many people using handheld solar meters to test light therapy devices. The problem is that these meters are designed to measure sunlight, not LEDs, and they often read two to three times higher than the actual value. That’s why I rely on a spectrometer—because accuracy matters.
Of course, you can spend far more than $2,500 if you want laboratory-grade equipment with tighter tolerances and advanced features. For me—and for most reviewers, biohackers, or enthusiasts who want accurate irradiance figures—this device hits the sweet spot between performance and price.
What Can You Use It For?
It’s not just about testing red light therapy panels. I’ve used this spectrometer to:
- Measure blue light transmission through glasses
- Compare sunlight across different times of day
- Analyze the light emitted from a fire
- Check how much light penetrates bone
The possibilities are endless.

Final Thoughts
Would I recommend buying one? Honestly, for most people, the answer is no. You’d probably be better off spending that $2,000 on a high-quality red light therapy panel and then relying on my reviews for the accurate data.
But if you’re someone who geeks out on this stuff—whether you’re a reviewer, a biohacker, or just someone who wants to dive deep into light analysis—then yes, it’s a worthwhile investment. It’s accurate, portable, and packed with features.
For me, it’s been one of the most important tools I own. It’s how I get the data you see in my reviews, and why I can confidently share irradiance figures that you can trust.

Here are the products I mentioned in my review.
⭐ Mention ALEXF when emailing for more details. Email Hopoocolor: [email protected]
Found This Post on Red Light Therapy Interesting? Then You Might Like:
🔴 36 Powerful Red Light Therapy Benefits
🔴 Red Light Therapy Wavelengths Benefits: The Ultimate Guide
🔴 Sun Exposure & Melanoma Risk: The Huge Light Therapy Implications
🔴 Gut Health & Red Light: A Surprising Connection
Consider These As Well:
🔴 Revealed – The Ultimate Red Light Therapy Panel Shopping Tool
🔴 Why Red Light Therapy Didn’t Stop Me Aging
🔴 Flashlights Replacing Red Light: Does This Work?
🔴 How to Find YOUR Best Red Light Therapy Mask
Alex's Bio
Alex Fergus wrote this blog post. Alex is an ISSN Sports Nutrition Specialist, Fitness Professional, and certified Superhuman Coach who continues to expand his knowledge base and help people worldwide with their health and wellness. Alex is recognized as the National Record Holder in Powerlifting and Indoor Rowing and has earned the title of the Australian National Natural Bodybuilding Champion. Having worked as a health coach and personal trainer for over a decade, Alex now researches all things health and wellness and shares his findings on this blog.